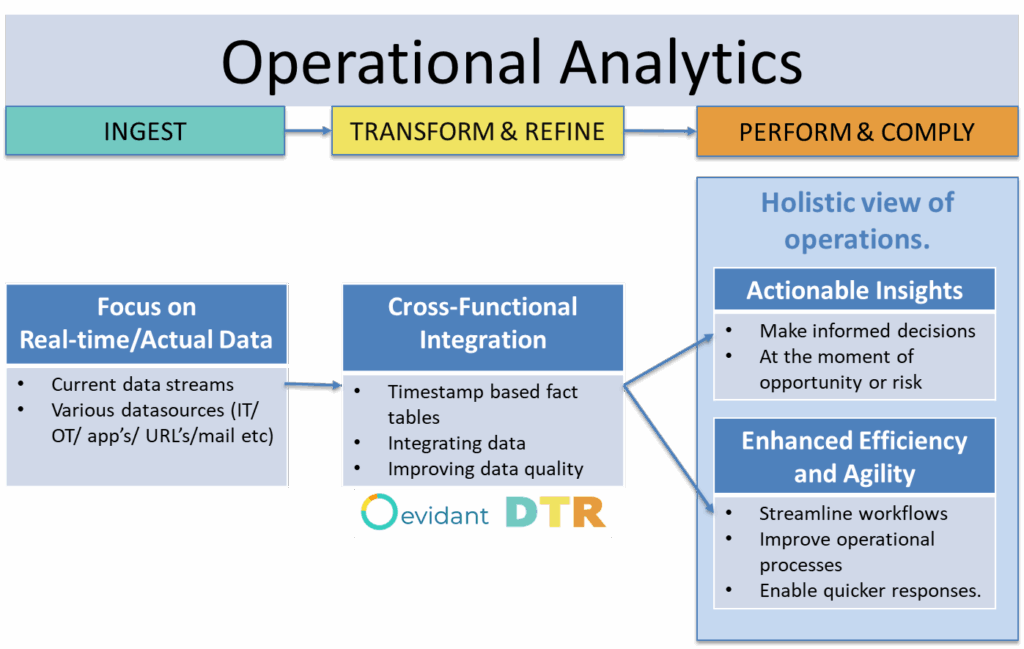
The diagram provides a visual representation of the Operational Analytics process, highlighting how real-time data is ingested, transformed, and used to drive performance and compliance across business operations. The framework is divided into three main stages:
1_Ingest
The process begins with the ingestion of real-time or actual data from a wide variety of sources. These sources can include:
* IT and operational systems (IT/OT)
* Applications
* URLs and web services
* Emails and other digital channels
The emphasis here is on current data_streams, which form the basis for responsive and timely decision-making.
2_Transform_and_Refine
Once data is ingested, it undergoes transformation and refinement. This stage involves:
* Creating timestamp-based fact tables to track and organize process & resource performance & compliance over time
* Integrating data from multiple systems to form a unified dataset
* Improving data quality to ensure reliability and accuracy
This cross-functional integration is critical to enabling a complete, real-time view of operations across departments and systems.
3_Perform_and_Comply
The refined data is then used to drive performance and ensure compliance.
This results in a holistic_view_of_operations, which powers two key business outcomes:
* Actionable_Insights
Support immediate, informed decisions
Allow quick responses to opportunities or risks as they arise
* Enhanced_Efficiency_and_Agility
Help streamline workflows and processes
Enable faster and more flexible responses to operational changes
Conclusion
This end-to-end flow—from Ingest to Perform & Comply—illustrates how operational analytics enables organizations to transform raw, real-time data into actionable intelligence. The result is improved decision-making, operational agility, and continuous performance optimization across the enterprise.